
Why MariaDB Performance Gets Slower Over Time in Enscale
Most MariaDB slowdowns don't arrive with a bang. There's no outage, no error, no obvious moment where things broke. The database just gets a little heavier to be around. A report that used to be instant makes you wait.
A dashboard hangs for a beat at 9am. And because nothing actually failed, it's easy to shrug it off and move on.
That slow creep has a name: performance drift. It's what happens when your workload keeps changing and your database configuration doesn't. This post is about why it happens, how to catch it early, and how to stop treating the symptoms one query at a time.
Key Takeaways
- MariaDB performance rarely fails outright. It drifts, as your workload grows while your configuration stays put.
- You can measure drift: watch
Innodb_buffer_pool_readsclimb as a share ofInnodb_buffer_pool_read_requestsas reads shift from memory to disk.- Adding cloudlets masks drift, it doesn't fix it, so the bill climbs while performance stays unpredictable.
- The real fix is keeping configuration aligned with real usage over time, which is what a database advisor like Releem does: it recommends, you review and apply.
Performance doesn't fail, it drifts
When you first set up a MariaDB node, the configuration fits the workload in front of you. The buffer pool is sized for the data you have, connection limits match your traffic, memory is allocated for the queries you're running. On day one, everything lines up.
Then the workload moves and the configuration stays put. Your dataset grows. Someone ships a reporting feature that runs heavier queries. Traffic gets spikier. Concurrency climbs. None of that edits your my.cnf, so the distance between "how the database is set up" and "how the database is actually used" widens a little every week.
For a long time you won't notice, because MariaDB is good at hiding it. Queries still return. Pages still load. The slow bits are small enough to blame on a busy afternoon. But the gap is real, and it compounds.
What drift actually looks like
Drift shows up as a handful of symptoms that each look minor on their own:
- reports that used to finish in seconds now take noticeably longer
- admin pages that slow down specifically during your busiest periods
- CPU spiking at times that used to be quiet
- queries that once used an index now scanning large chunks of a table
Here's a concrete way to see it rather than guess at it. As your working set outgrows the InnoDB buffer pool, MariaDB has to fetch more data from disk instead of memory. You can watch that happen:
SHOW GLOBAL STATUS LIKE 'Innodb_buffer_pool_read%';A healthy database serves the overwhelming majority of reads from memory, so Innodb_buffer_pool_read_requests (reads from the pool) should dwarf Innodb_buffer_pool_reads (reads that had to hit disk). When that second number starts climbing as a share of the first, your buffer pool no longer holds your working set, and disk I/O is quietly becoming your bottleneck. That's drift you can measure.
A pattern we see all the time
An app launches on MariaDB and runs beautifully. Queries are quick, resource use is flat, everything feels solid.
A few months in, the dataset has doubled, a couple of reporting queries have been added, and traffic has gotten lumpier. A report that ran in seconds now takes the better part of a minute. Admin pages drag during peak hours. CPU spikes at times that used to be calm.
The instinct is to add cloudlets, and it works, for a couple of weeks. Then the same symptoms come back. At that point it looks like a scaling problem. It isn't. Settings like innodb_buffer_pool_size, connection limits, and cache sizes simply no longer reflect how the database is being used. More rows are being read from disk, query plans have quietly gotten worse, and CPU and I/O are carrying load they shouldn't have to. Nothing "broke." The configuration just stopped matching reality.
Why scaling buys time instead of fixing it
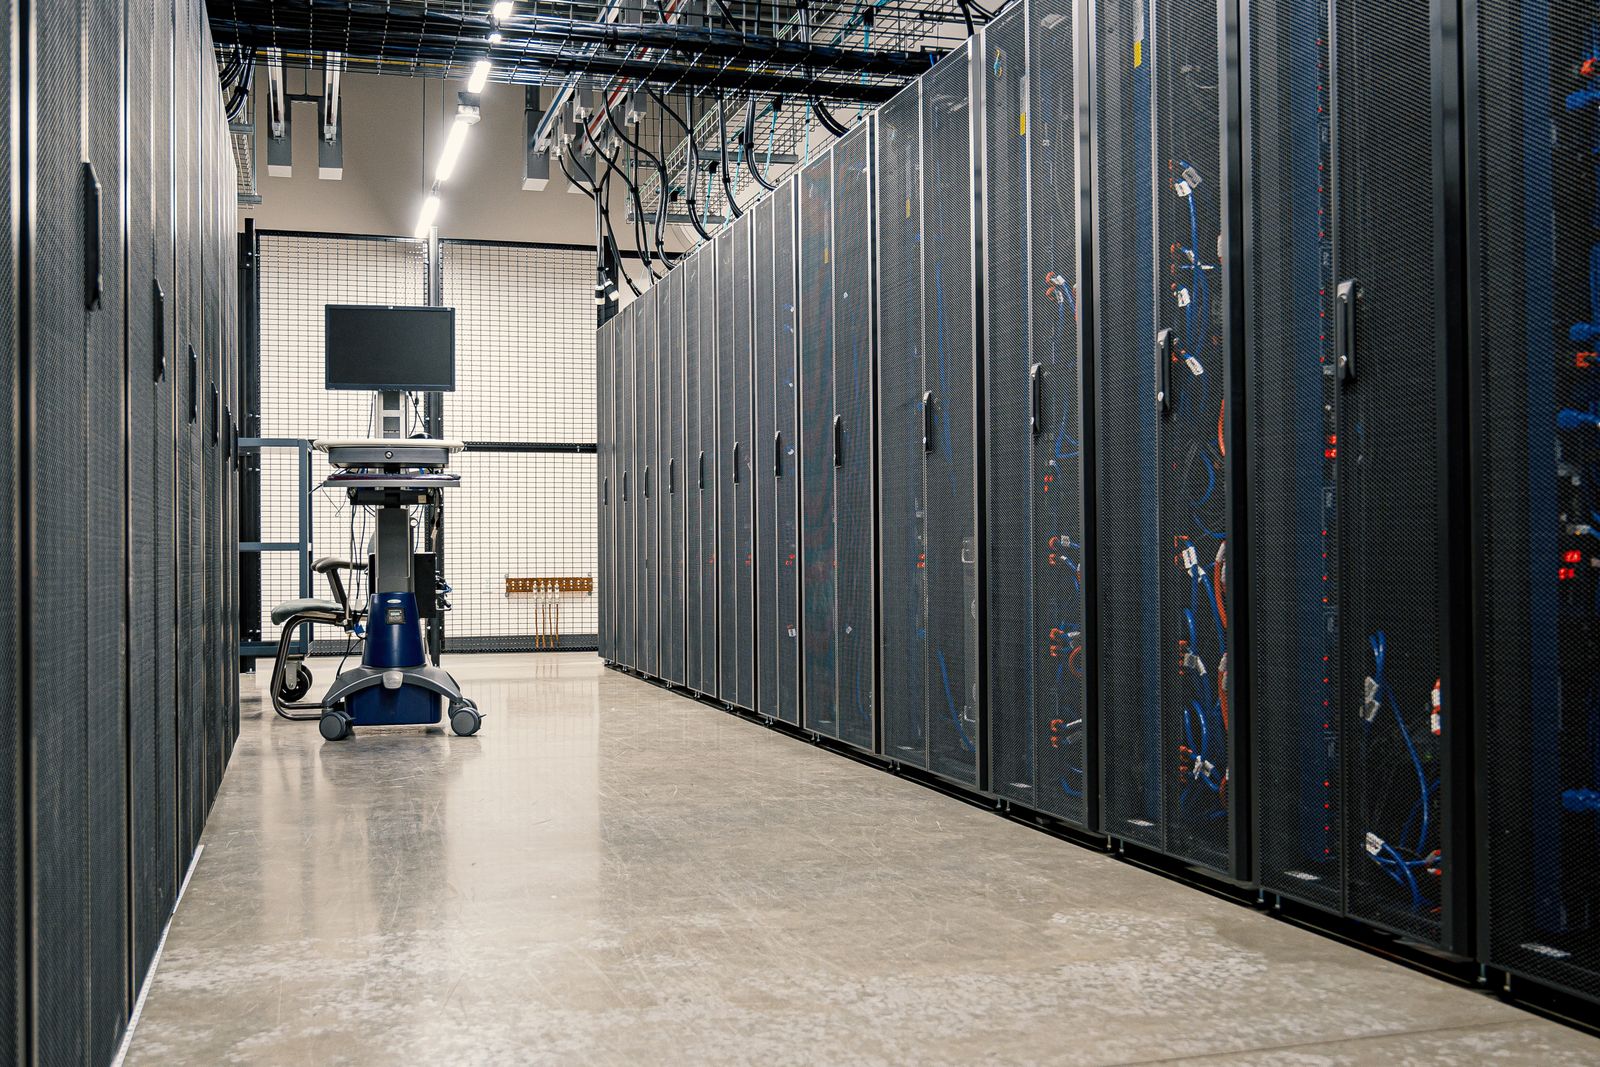
Scaling on Enscale is genuinely easy, which is exactly why it becomes the default reflex. Something's slow, so you add resources, and the pressure eases.
The trouble is that more memory and CPU don't realign a configuration with a workload. They give the misalignment more room to hide. So the symptoms fade, then return, and you scale again, and the loop that actually costs you money sets in: investigate, patch, add cloudlets, repeat, while the bill climbs and performance stays unpredictable. You end up paying more for a database that behaves less predictably than it used to.
What actually fixes drift
There's no one-time tune-up that keeps a moving workload aligned. What fixes drift is the thing that caused it, reversed: keeping the configuration in step with how the database is really being used, on an ongoing basis. In practice that means:
- watching how queries behave over time, not just when something breaks
- understanding how the working set changes as data grows
- adjusting memory, buffer sizing, and connection handling to match
Do that continuously and drift is something you manage. Skip it and drift is something that eventually manages you. The catch is that doing it by hand doesn't scale. In a small, stable system you can read the slow query log yourself now and then. As the system grows, queries multiply, patterns get harder to spot, and changes come faster than you can review them, which is where most teams slide into permanent reactive mode.
Where Releem fits
This is the gap Releem is built for. It runs as an add-on inside your Enscale environment and analyses how your database actually behaves, then tells you where the configuration has fallen behind and what specifically to change. It looks at memory and buffer pool behaviour, query activity and the inefficient patterns that cost the most, connection behaviour, disk I/O, and configuration values that no longer fit the working set. When it finds a gap, you get a plain recommendation: this setting, changed to this, for this reason.
Two things stay true. Applying a change is your call: Releem recommends the fix and explains why, and you apply it, in a click in the dashboard or with your own database tools, once you've read it. Manual review is the default and how we'd recommend running it, and if you later decide you want Releem applying routine changes for you, that's your decision to make. And your data stays in your database: the agent runs on your own node inside Enscale and reads performance metrics, configuration values and query statistics, never the contents of your tables.
It's also worth being precise about what kind of AI this is, because the term is doing a lot of heavy lifting in marketing everywhere right now. Releem is not an LLM. It isn't ChatGPT or Claude pointed at a database, and it doesn't generate a confident-sounding guess and hope it's right. It runs on trained machine learning, so recommendations come from patterns in real database behaviour rather than predicted text, and it won't hallucinate a fix that looks plausible and isn't.
And it gets better the longer it runs. Every recommendation it makes and every change you choose to apply becomes part of a history of your environment, so over time the advice stops being generic and starts being shaped around your database and what has already worked for you. It won't only wait for something to break, either. When there's headroom to make things faster or leaner while everything is running fine, it'll flag that too.
What this means in practice
When configuration keeps pace with workload, the day-to-day changes:
- lower CPU during peak periods
- memory that's actually working for you instead of sitting idle or thrashing
- fewer cloudlet expansions you didn't really want to pay for
- query times that stay steady as you grow
The real prize isn't raw speed, it's predictability. You stop being surprised by your own database.
Frequently asked questions
Why does MariaDB performance get slower over time?
Usually because the configuration doesn't change as the workload does. Memory allocation, buffer pool sizing, and connection limits are set for the data and traffic you had at deployment. As data grows, queries get heavier, and concurrency rises, those settings become a worse and worse fit, so more reads come off disk, query plans degrade, and execution time creeps up. The database didn't break; it drifted.
How do I know if my MariaDB configuration is out of alignment?
Watch for queries getting slower without being changed, CPU climbing during peak periods, and a rising share of reads coming from disk instead of the buffer pool (compare Innodb_buffer_pool_reads against Innodb_buffer_pool_read_requests). Performance that feels less predictable under load is the tell-tale sign.
Can I just add more CPU or memory to fix it?
It helps temporarily, but it doesn't realign configuration with workload, so the same symptoms return as you grow. Scaling relieves pressure; it doesn't close the gap that's causing it.
How do I fix MariaDB performance without constant manual tuning?
Keep configuration aligned with real usage on an ongoing basis rather than tuning once and hoping. That's what a database advisor like Releem is for: it analyses your actual workload and recommends specific changes for you to review and apply, so you spend your time approving fixes instead of hunting for them. Alignment is maintained continuously instead of in occasional firefights.
If your MariaDB performance is starting to feel less predictable, drift is already in progress, and it won't settle on its own. Releem gives you continuous eyes on the database and tells you exactly what to adjust, while you keep the final say.
See how Releem works on Enscale, and install it on your database node →
Already an Enscale customer and ready to go? Install Releem now →