
How to Tune the Garbage Collector in Tomcat
The guys at PayPal recently switched away from Java, citing (perhaps false/questionable ?) performance gains. One important, but easily overlooked, way to keep your Java app performing at its best is to make sure that the JVM is well tuned to your needs – that includes taming the Garbage Collector.
If Java had true garbage collection, most programs would delete themselves upon execution.
– Robert Sewell
Java’s Garbage Collector does an important job, and if you tune it properly, you can prevent memory intensive programs from freezing your system. It’s easy to assume that if you know how to develop large programs and applications, you probably already know how the Garbage Collection process works. Ergo if you choose the right Garbage Collector algorithm, it means you totally understand the features of the program you have developed.
If you’re not quite sure how the whole process works, we’ll try to summarise the most important aspects for you.
Meet the Garbage Collector, it will save your day!
You’ve just developed a large application, and you couldn’t be more excited! But, as this application runs, it creates objects; as it continues to run, many of these objects are no longer required and they cause your program to run out of memory for no apparent reason.
This is where the Garbage Collector steps in: it eliminates unused objects and recycles memory that it can prove will never be used again. This process is known under the name of Garbage Collection (GC). GC avoids the need for the programmer to deallocate memory blocks explicitly, thus avoiding a number of problems: memory leaks, double frees, and premature frees.
However, the GC can be a drain on your server, using valuable CPU power. No worries, there is a solution for that, too. You can reduce the frequency with which these processes occur by using the -Xmx and -Xms switches to control how JVM handles its heap memory. Use the -Xmx switch to start the JVM with a higher maximum heap memory. This will free up CPU time for the processes you really care about. To maximize the effectiveness of this technique, use the -Xms switch to ensure that the JVM’s initial heap memory size is equal to the maximum allocated memory.
Java does not explicitly specify a memory address and remove it in the program code, so the Garbage Collector finds unnecessary (garbage) objects and removes them.
Understanding your code means understanding Garbage Collection
The GC collects heap memory (the portion of the memory where dynamically allocated memory runs). The heap memory is split into several regions and the placement of the objects within each region corresponds to their age. Usually, the heap is divided into two areas: the young generation and the old generation. Objects are created in the young area and once an object has survived a couple of GC cycles it is moved to the old generation.
The heap is created when the JVM starts up and may increase or decrease in size while the application runs. When the heap becomes full, garbage is collected. GC simply clears the unused object in Java. With an increasing number of objects, the number of GCs to be executed to clear them also increases. Therefore, to prevent GC worsening application performance, the number of created objects should be kept as low as possible. This means that before going through GC tuning, you should optimise your code first. If problems still exist, then carefully play with the GC configurations.
Choose your favourite Garbage Collector on the Jelastic platform
In Jelastic 1.9.2., the the self-scaling Java (and PHP) cloud hosting PaaS, the Garbage Collector can be tuned by the customer if desired.
If no custom GC is specified, Jelastic will continue to decide the most appropriate Garbage Collector, based on extensive testing by the Jelastic development team: Jelastic configures the Serial GC by default if you set the Scaling Limit below 1GB, and G1 GC by default if you set the Scaling Limit above 1GB (8 cloudlets).
It does not matter how many cloudlets are actively used in this case. The GC setting is adjusted automatically based on the configured Scaling Limit only (cloudlet usage and Reserved Cloudlet settings do not have any impact on it).
For compatibility reasons Jelastic leaves other parameters at defaults, with only slight tweaks to improve resource usage and scaling. Some of these options may affect performance, and can be optimised to suit a specific application – it’s best addressed with the full knowledge of the application by its developer; so you can tune this further according to the needs of your particular application if needed.
You can now set a custom GC (together with other JVM preferences, such as -Xmx and -Xms values) according to your own preference by simply editing variables.conf via the Jelastic dashboard.
Jelastic does the hard work
But, before getting to this point where you can choose your own Garbage Collector (if you want), Jelastic’s development team were pretty impressive making sure that the defaults are going to help you as much as possible.
The most important thing that makes Jelastic a unique and innovative platform – the vertical scaling – raised a significant problem in choosing the most appropriate default GC.
Jelastic measures RAM usage at the operating system level (to give a universal/consistent approach for all server types – MySQL, PostgreSQL, memcached etc.), so this would defeat the usage-based billing concept on Java servers:
If an application starts with a small amount of RAM usage, then adds more, the JVM can’t return that RAM to the OS when it is not needed anymore. The guys at Sun that designed the JVM used this approach to speed up the process of memory allocation by having it already queued.
This hasn’t stopped the team behind Jelastic; they tested different Garbage Collectors to evaluate which has the best vertical scaling properties: the Serial Garbage Collector, the Parallel Garbage Collector, the Concurrent Mark Sweep Garbage Collector and the G1 Garbage Collector. The conclusions from these tests were summarised in this well documented blog post by the Jelastic dev. team, so you can read about their extensive work first-hand there.
Suffice to say that the Jelastic PaaS is very smart about giving you the best possible platform to run your code on right out-of-the-box – but with the perfect blend of versatility and freedom to customise the configuration to power more demanding workloads / application developers.
The Jelastic platform should always help you out, never get in the way!
Set a custom Garbage Collector on Tomcat
In order to tune in the GC you will first need to create an environment with Tomcat as a server in your Jelastic account.
For this demonstration we’ll use VisualVM to illustrate the active GC, which needs a Public IP to be able to establish a direct connection with Tomcat:
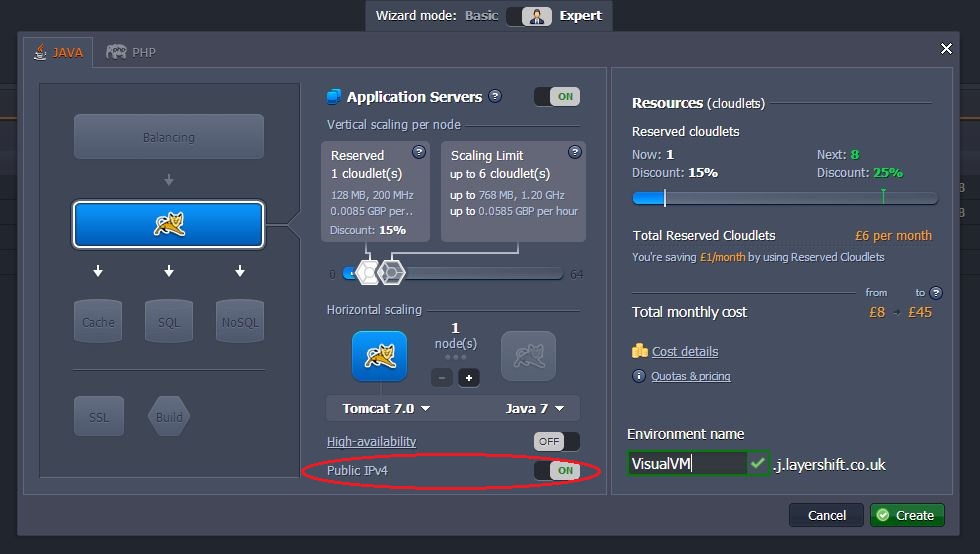
You can see your Public IP address in the dropdown list for Tomcat.

VisualVm is an interesting tool which allows you to interact with the Garbage Collection, among other functions (tracking threads, monitoring CPU and memory usage and many more). What you might not realise is that you almost certainly have VisualVM installed – it’s been included as a standard part of the JDK since Java 1.6 update 7. To install it and start monitoring your app in Jelastic, just follow the instructions in this article.
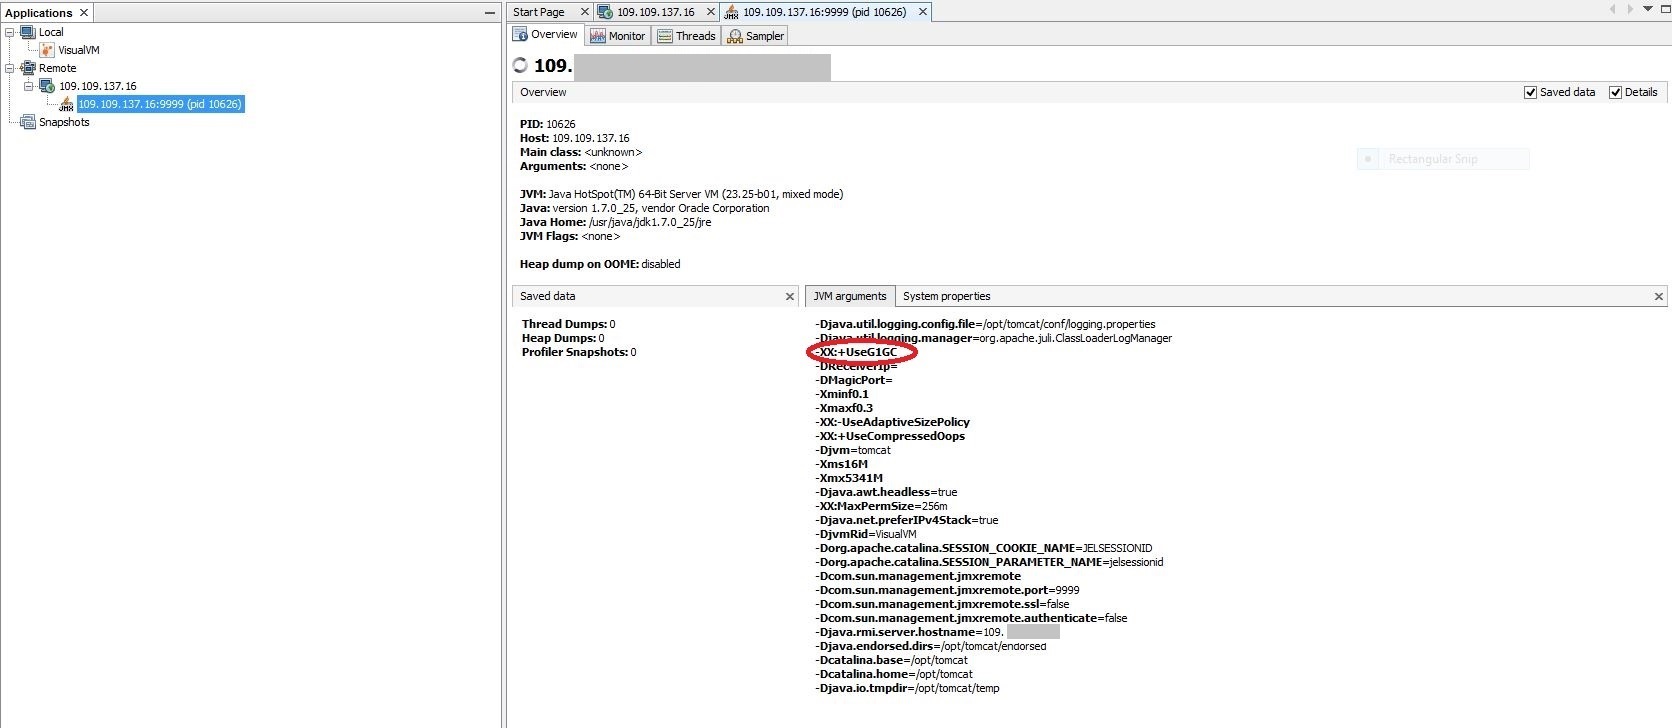
If you set the Scaling Limit of your environment below 1GB (8 cloudlets), then Jelastic configures the Serial GC, if you set it above 1GB, Jelastic configures the G1 GC by default.
You can check this in the short overview of your server in your VisualVM tool. We set the scaling limit above 1GB, so the configured Garbage Collector in this case was automatically set to G1 GC:
To set a different GC in your Tomcat environment, you need to navigate to variables.conf file (server directory) and set the following system properties:
-xx:+UseParallelGC
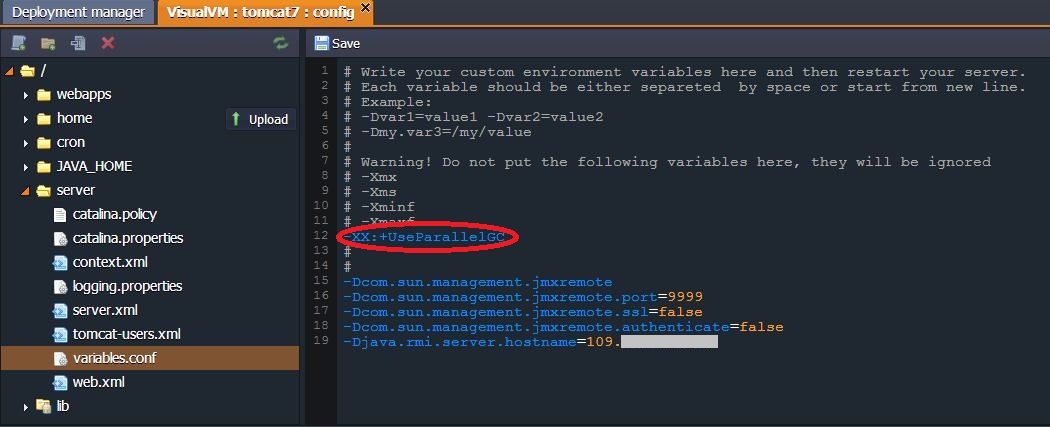
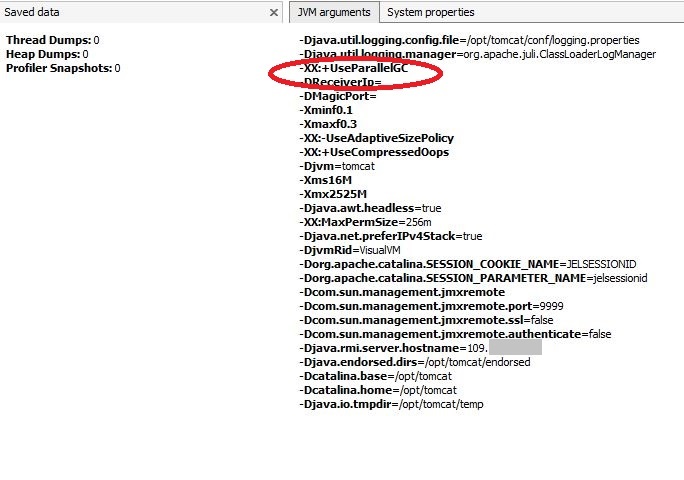
After that, just hit Save and restart your Tomcat server. You will be able to see the changes in your VisualVM tool after you restart this program too:
Conclusion
You’re probably familiar with this joke already:
Knock, knock.
“Who’s there?”
very long pause.
“Java.”
Java is high performance and highly scalable – but you have to do your part too. Take advantage of the added flexibility offered by the Jelastic platform by experimenting with the JVM’s GC options during your next performance audit.
Don’t have an account yet? No problem! Create your free account now!